
Using the 2018-2019 Adventure Works dataset, I developed a Sales Dashboard to monitor critical sales metrics and trends, identify underperforming regions, and provide insights into opportunities for expansion.
The dataset spans originally spans from 2017 to 2020, but only 2018 and 2019 contain complete annual data. Thus, we focus on the most recent comprehensive dataset from 2019. The process starts with data modeling, ensuring proper relationships between dimensions and the fact table. Each column is also checked to ensure it has a suitable data type. Additional columns and metrics are added via DAX to supply the necessary data. We begin the analysis after guaranteeing the data's consistency and reliability.
Analysis
Sales Growth Between Current and Previous Year
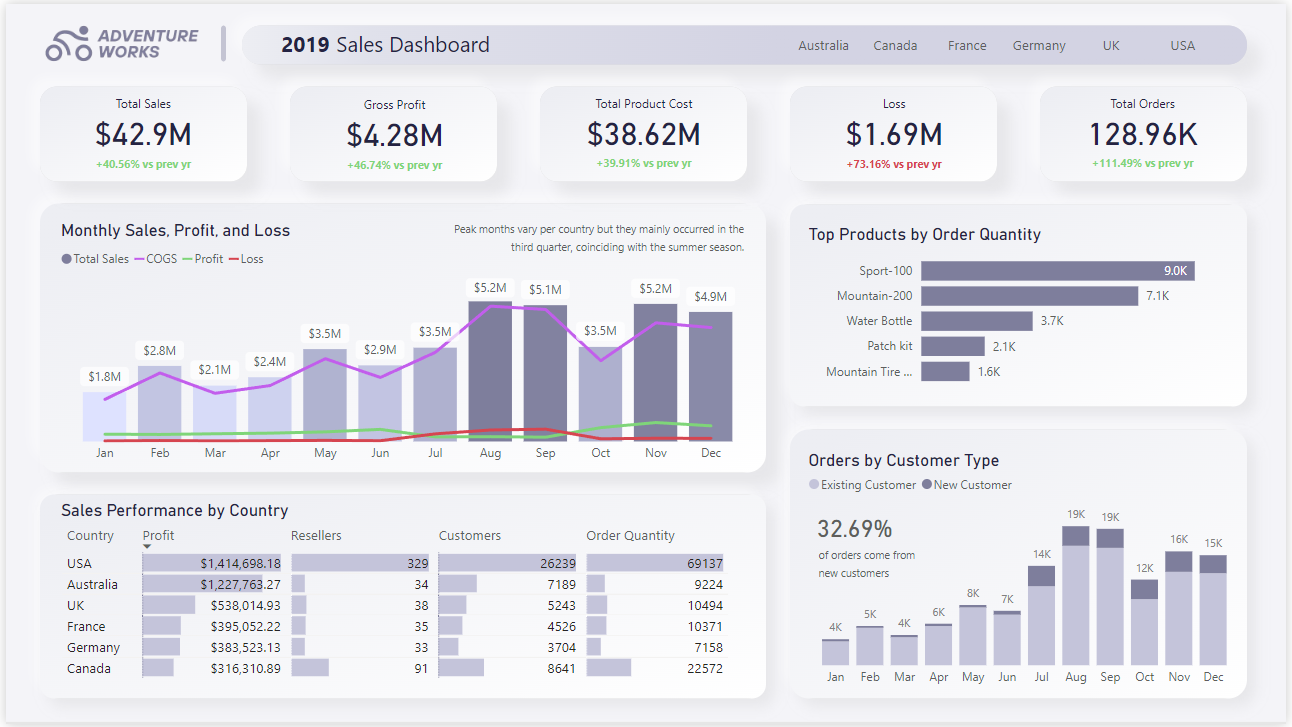
In 2019, total orders and sales increased by around 41% compared to the previous year, indicating positive growth. The total product cost also increased by 40%, which was reasonable given the increased number of products sold. Although profits exceeded losses, the increase in losses outpaced the increase in profit by approximately 20%, indicating possible inefficiencies or problems despite total revenue growth.
Monthly Sales, Profit, and Loss
Sales are low at the start of the year, but data reveals a general upward trend across countries. Peak months vary per region, although they mainly occurred in the third quarter, coinciding with the summer season and suggesting increased customer activity. However, profits decline during these peak months, prompting further research into potential factors influencing profitability despite higher sales.
Sales Performance by Country
The United States has the highest metrics across various parameters. Its profits are double its losses, reflecting its stability and solid financial success.
The Australian market presents interesting dynamics, where despite having the second lowest number of orders and resellers, it emerges as the second-highest profit generator, following only the United States, and ranking third in customer count. Notably, Australia accounted for no losses in product sales from January to July. Understanding this could provide prospects for future expansion in the Australian market, guiding us on the direction to take for growth.
In contrast, Canada has the second-highest number of resellers, consumers, and orders, yet its profitability is the lowest. They also exhibited negative profits for August and September. Furthermore, Canada has the smallest percentage of new clients. Exploring these aspects is critical for developing targeted strategies that optimize profitability and create sustainable growth in the Canadian market.
Most In-demand Products
The Sport-100 Helmet is consistently the most in-demand product in all countries. In addition, the Mountain 200 bike and patch kit are in the top five in every country except Canada.
Customer Loyalty
Purchases in all countries are predominantly made by existing customers, indicating strong customer loyalty. Leveraging this loyalty provides an opportunity to use our existing client base as advocates to acquire and engage new customers.
Recommendations
Loss Reduction
Due to the considerable increase in losses, it's imperative to conduct further analysis of the contributing factors and formulate a strategy to convert loss into profit.
Address the factors contributing to the high loss rate in Canada, including customer behavior and market dynamics, by undertaking a more in-depth study. Consider tailoring promotions to better resonate with Canadian customers.
Maximize Sales
Increase promotions and bargains during the first and second quarters when sales are low while guaranteeing sufficient inventory to meet the increased demand in the third and fourth quarters.
Expansion Opportunities
Closely monitor the Australian market since it shows promising sales and profit figures. Understand what kind of products are in demand there that makes them profitable.
Leverage existing customers as advocates to encourage prospective buyers and boost their loyalty.