
From small to big companies alike, raw data can be overwhelming. Fortunately, we can use accessible tools such as spreadsheets to transform our data into something easier to derive insights from. Let me give you a walkthrough and see the wonders that MS Excel can do.
I created a dashboard to monitor employee records, identify segmentation, and analyze statistics for the HR department, providing a comprehensive overview of the company's workforce details at a glance.
The top panel of the dashboard displays essential statistics that we want stakeholders to see. It features the total and active employees, allowing them to see our overall and current workforce easily. In the middle, average engagement and satisfaction scores reflect the performance state of employees. The rightmost section is customized as the user moves from the main dashboard to the performance dashboard, displaying the average data for particular charts.
Main Dashboard
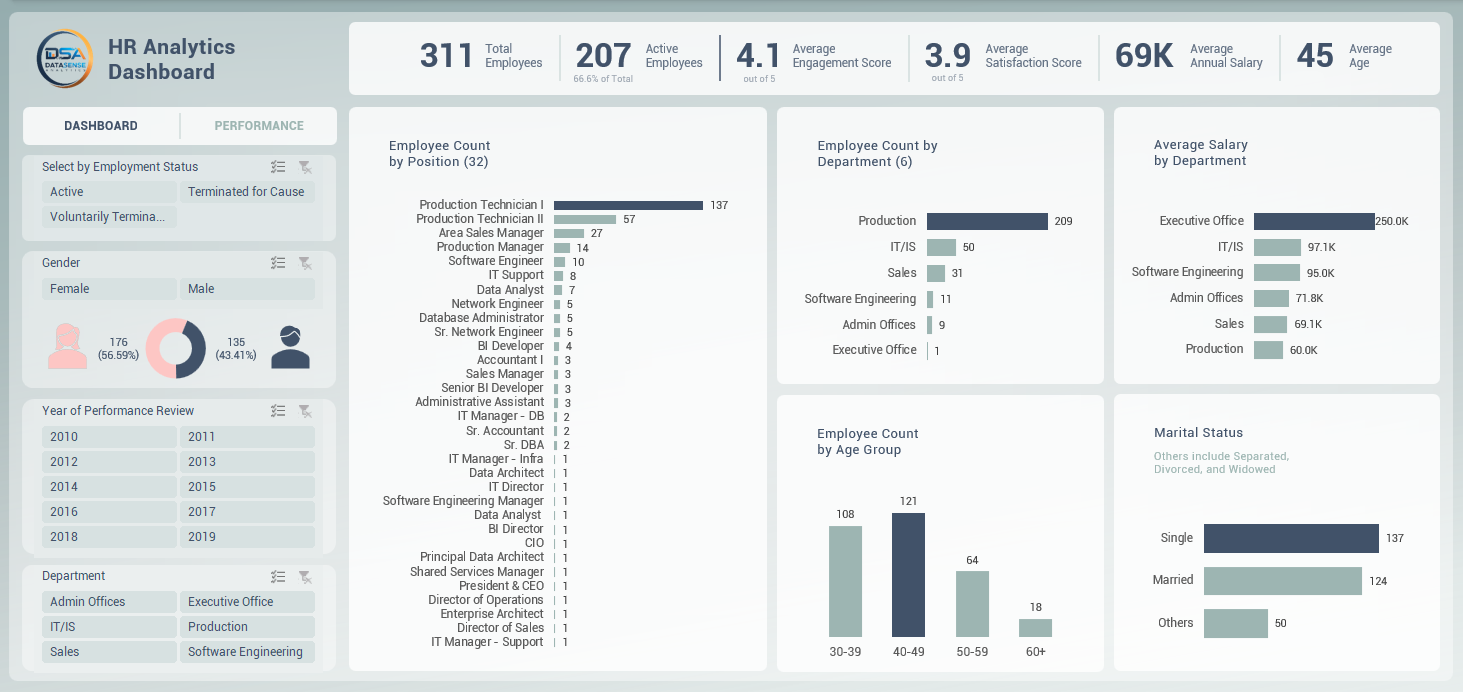
Workforce Composition
The main dashboard lets us see the company's workforce composition in more detail through charts about Employment Count by Position, Department, Age Group, and Marital Status. These charts allow us to understand the organization's scale and demographic makeup, which are crucial factors in decision-making processes.
Moreover, the Average Annual Salary by Department is included to compare manpower and wages across different departments. Production has the highest headcount, aligning with its operational demands, but with significantly lower salary which is a common trend in the industry.
Performance Dashboard
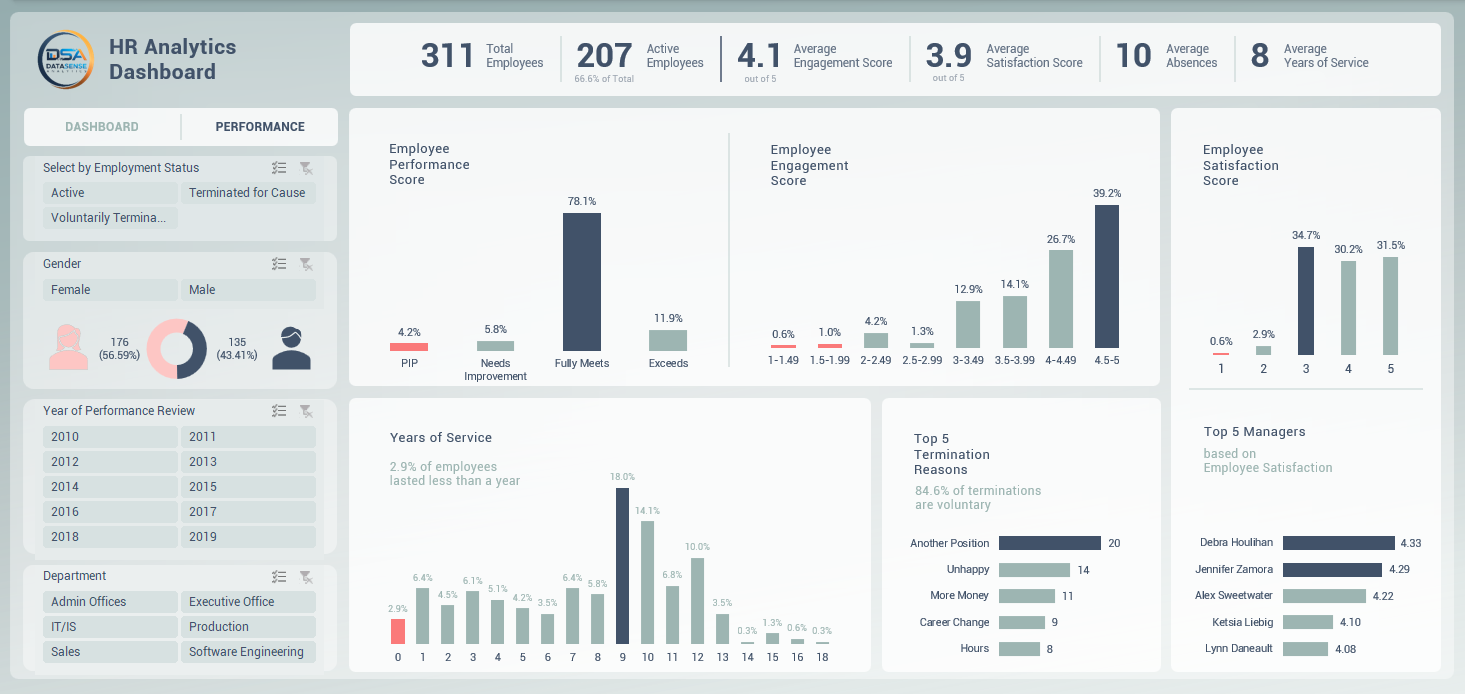
Employee Performance
The performance dashboard shows that approximately 90% of employees meet performance and engagement standards, yet there is still a small segment that needs further support for growth.
Employee Satisfaction
Employee satisfaction appears to be a key area of focus. Scores show a predominance of a rating of 3 with an average of 3.9, suggesting space for improvement in overall job satisfaction. In connection with this, the high voluntary turnover rate (84.6%) is critical, with reasons including seeking different positions and unhappiness. Within the dashboard, we can also identify managers whose teams have better average satisfaction levels, providing valuable insights into suitable leadership methods.
Employee Loyalty
Furthermore, with an average employment duration of 8 years and a sizable proportion exceeding 9-10 years, we see admirable employee loyalty.
Recommendations
Boost Employee Satisfaction and Performance
The company maintains good employee satisfaction, but there is still room for improvement. It's imperative to delve deeper as to why about 38% of employees express only moderate satisfaction and also understand the reason for those who provided high satisfaction scores.
After this, we can tailor a more suitable management plan to elevate employee satisfaction without jeopardizing engagement.
Assist Low Performing Employees
Consider assigning high-rated managers to mentor or focus on underperforming employees within their respective teams.
Employee Retention
Offer employees raises or promotions based on turnover trends, minimizing the likelihood of having them leave the company for another position.